[Zoho CRM] Unlock Enhanced Reporting Features for Powerful Data Analysis
Dear Valued Clients,
We're excited to share some significant upgrades to Zoho CRM that will enhance your data analysis and reporting capabilities, empowering you to derive more actionable insights and make informed decisions. Let's dive into the details of these improvements and how they can benefit your business.
Here are the key enhancements in this update:
Export Limit Increase
Previous limit: Previously, Zoho CRM had export limits of 50,000 records with a 5-export limit per day.
New limit: They have now expanded this limit to 200 exports per day for all users, with Ultimate Edition users enjoying an extended limit of 300 exports per day.

Export Permission for Users
Zoho has added the "export" permission as a profile permission for the Reports
module. This enhances data security and privacy controls by enabling
administrators to regulate the export of sensitive information, thereby
ensuring compliance and preventing unauthorized data access.

Email Templates for Reports
Personalize report delivery with customizable email templates, enabling tailored content for each recipient.
For
instance, a sales manager can create an email template for a weekly
sales performance report. With this template, the manager schedules the
report to be sent every Monday morning to the sales team. This
automation ensures that all stakeholders receive timely updates on sales
metrics. You can include placeholders for dynamic data such as
recipient names, the report's name, the report's ID, account details, or
sales figures. This customization adds a personal touch to the reports,
making them more relevant to individual recipients.

Email Templates for Scheduled Reports
You can also choose email templates for scheduled reports.

Enhancements to Grouping Options
Month Granularity: Users can now group data by month to make it easier to analyze trends over time.
Previously, Zoho CRM data grouping feature allowed users to group data by the "calendar
month" of a date or date/time field, which meant the month was grouped
along with the year. For instance, all data from this month would be
categorized under "March 2024". However, this method makes it
challenging to isolate data for specific months.
Introducing
a "month" grouping enables users to group all occurrences of a
particular month together, regardless of the year. This enhancement
offers greater flexibility in analyzing trends over time by allowing
users to easily identify which month in the last five years generated
the highest revenue.
Use case
Let's
say you're analyzing user engagement over the past year. With the new
month granularity feature, you can now group the number of new clients
added year over year by month or compare revenue year over year by
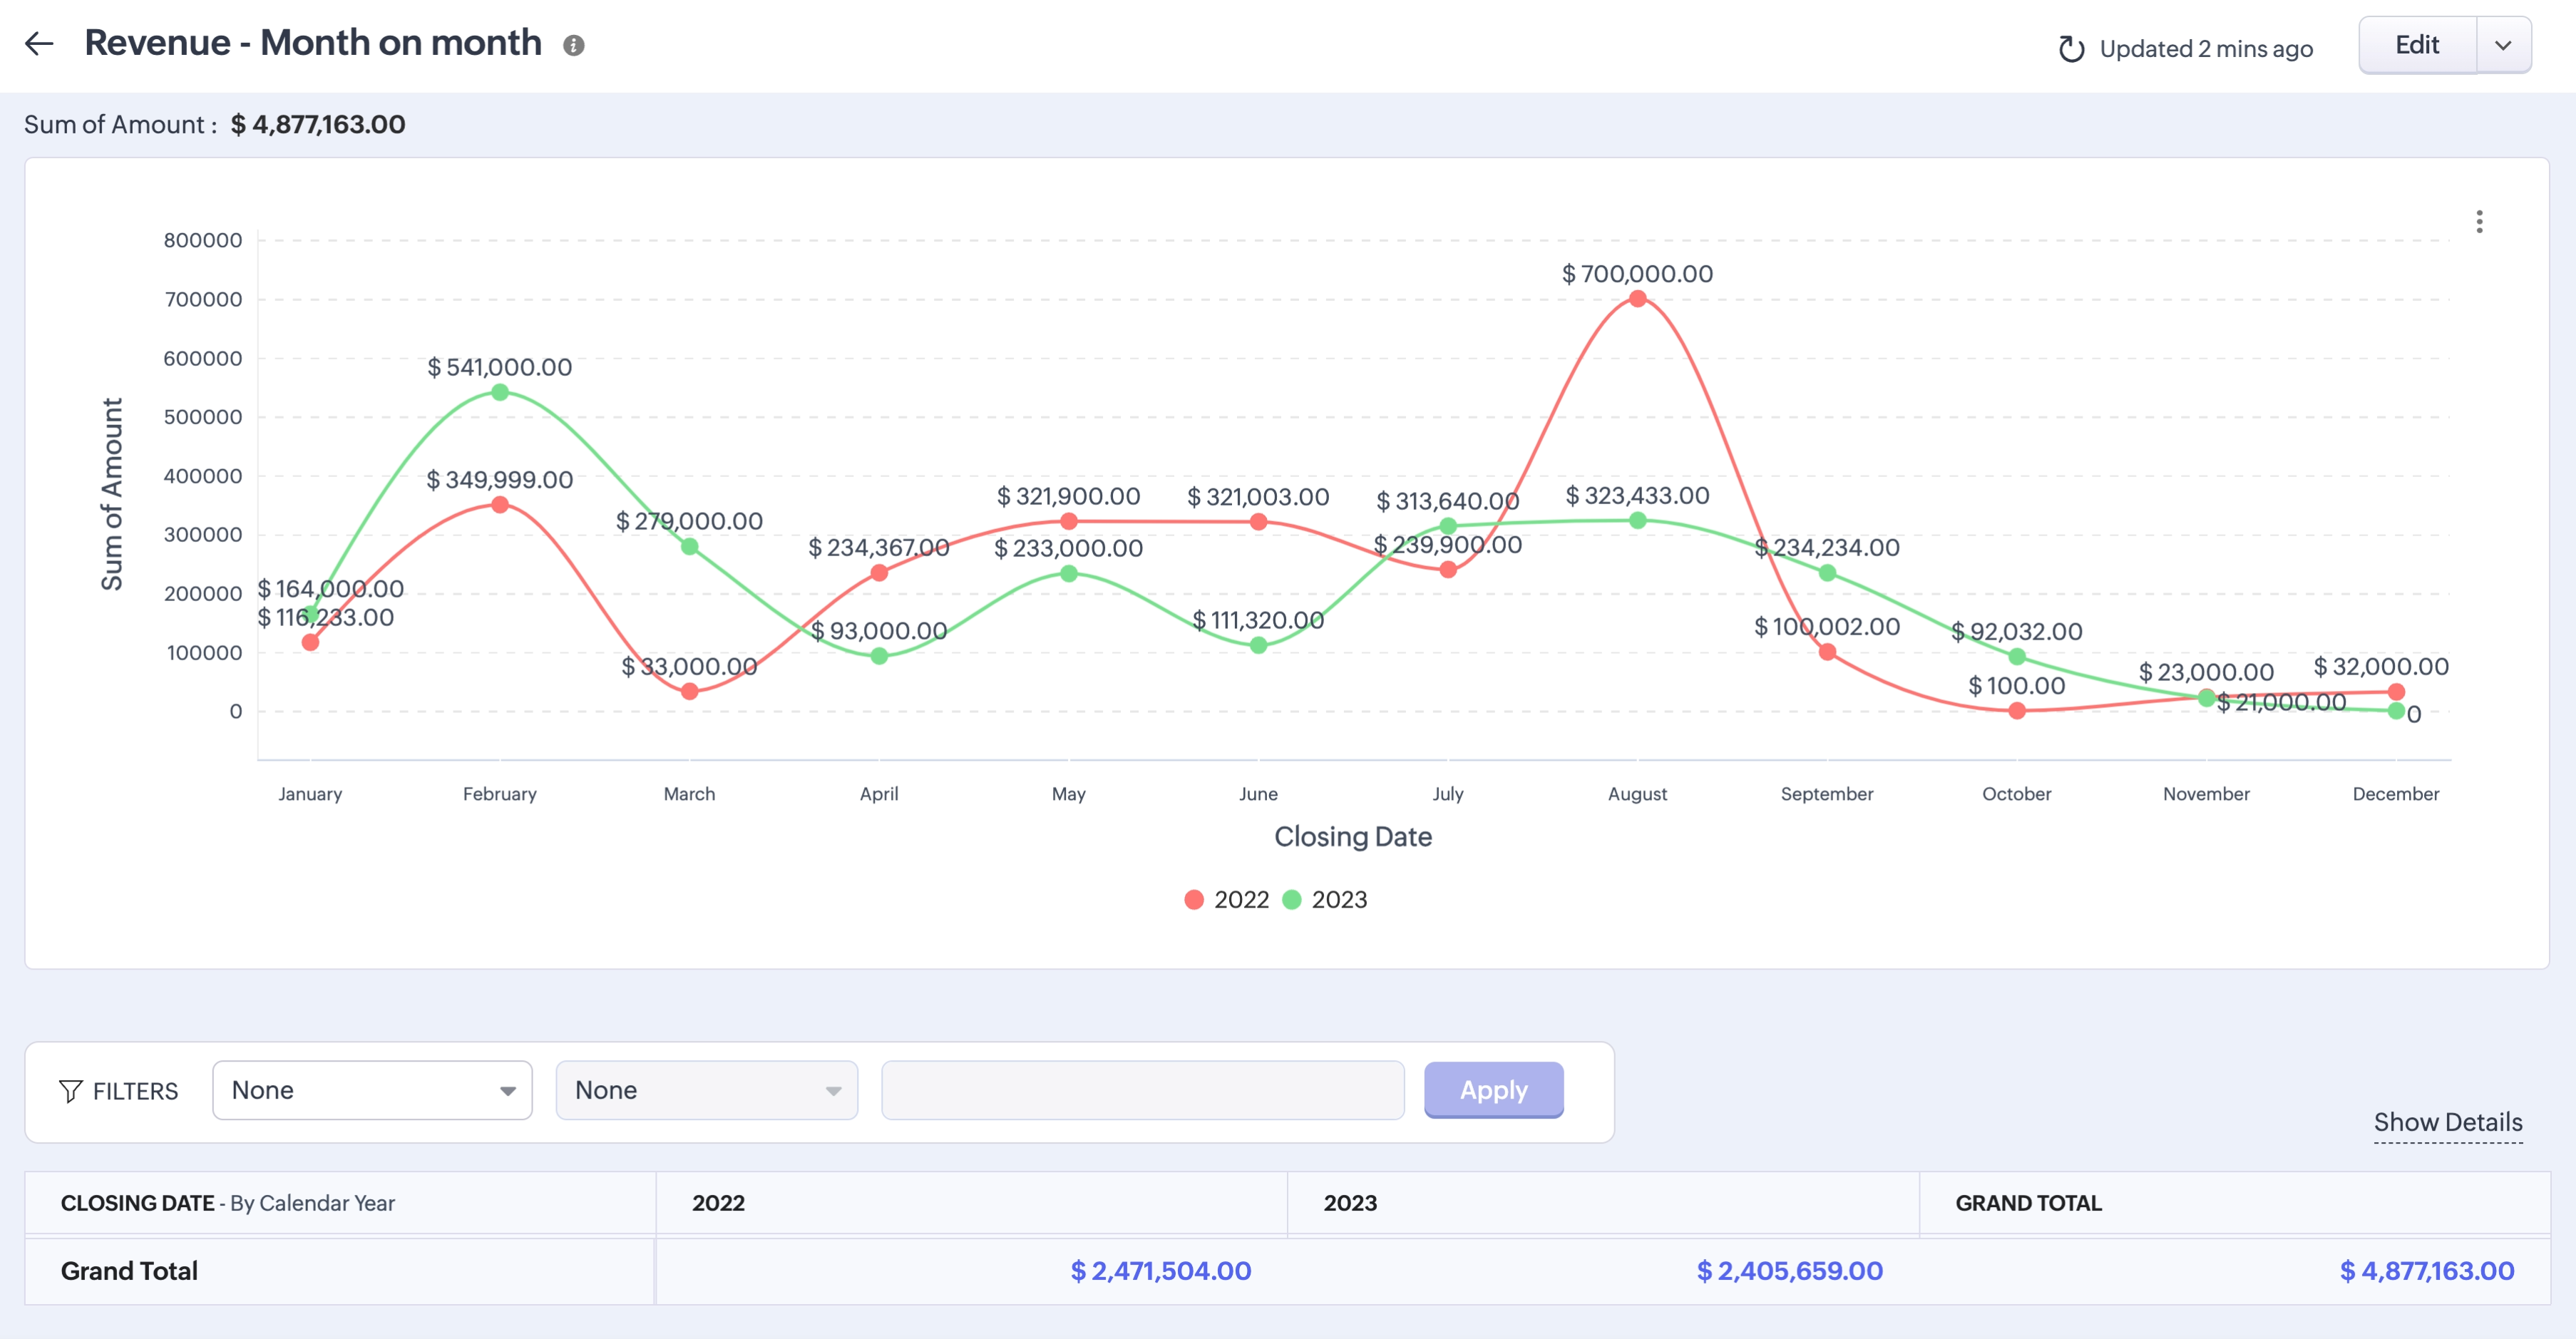
month, making it easier to analyze trends over time. By understanding
monthly usage patterns more clearly, you can refine your product
offerings and optimize your marketing strategies to meet your users'
needs more effectively. Below is an example of revenue generated for the
past two years compared month-wise:

You can also create charts for this report to view the performance of both years clearly.
Day Granularity: Conduct detailed daily analysis for precise insights.
With
the day granularity feature, you can now group your data by day,
enabling detailed daily analysis within your reports and empowering you
to identify peak usage times, detect usage anomalies, view the birthdays
of all contacts in a single report, and so on.

You can view the same data in a bar chart to identify trends, patterns, and anomalies easily.

Column Grouping
Previously,
the Reports module in Zoho CRM only supported 2x2 grouping, where the
first number denotes the row and the latter number denotes the column.
With this enhancement, you can group columns based on 3x1 or 1x3
combinations.

Overall,
grouping is simply a way to organize and visualize elements and to make
it easier to understand their relationships and structure.
Wrap Text
Ensure clear visualization of lengthy text data within reports for improved readability. Previously,
if the text in a description field was too long, it was displayed in a
single line, whereas the full text was displayed upon hovering the
cursor. After enabling text wrapping, description fields now display
text within cells with wrapping functionality, ensuring that lengthy
text is fully visible without the need for pop-overs or hover actions.

Minor Enhancements
Dynamic Column Width
The
system now automatically adjusts the sizes of columns in reports based
on the content within them. Instead of having fixed-width columns,
dynamic column widths allow columns to expand or contract as needed to
accommodate the content they contain. This feature is particularly
useful for optimizing the display of data, ensuring that all information
is visible, and making efficient use of available screen space.

Export
resized column widths with the same size in PDF and XLSX formats (not
technically possible in CSV) only for formatted report exports.
Role Support in Criteria
Users
can define criteria within reports based on the roles assigned to
users. This feature ensures that report data is filtered or restricted
based on the roles of the users viewing the report.
For
example, a report may be configured to show only the leads or sales data
that are relevant to the roles of the users accessing the report. Users
with different roles may see different subsets of data, ensuring that
they only have access to the information that's pertinent to their
responsibilities.

Select All Option
The
selection feature enables users to conveniently select all fields in a
module or select multiple fields using the shift+click key combination.

These
enhancements aim to streamline your data management processes and
provide you with more control and flexibility in your reporting and
analysis endeavors.
Stay tuned for more updates!
Feature availability
Available for all users in all DCs.
Topic Participants
Nurul Asyiqin Mostafa